NOVEMBER 2021 | SANTA BARBARA REAL ESTATE UPDATE
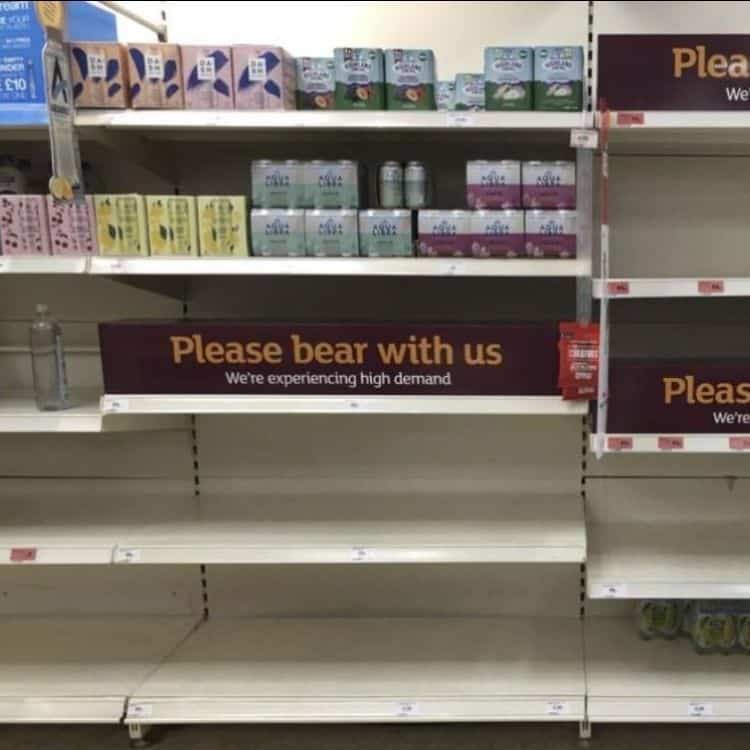 There is not much on the shelves!
As we enter the fall of 2021, our market has made one noticeable change, less homes have sold. The surge in our sales volume that we had been experiencing has reduced back to near our typical or average sales volume.
But like so many other businesses, the drop in sales is tied to a supply problem.
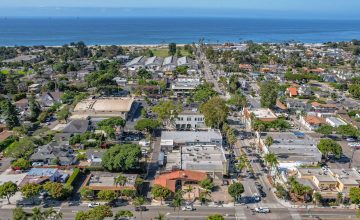
On November 17th, only 128 homes and condos were available for sale or on the shelf. We wish we had tracked this number monthly for years, but over the last six months we have continued to watch our inventory drop lower and lower. Historically, around a 4-6 month supply of homes is viewed as a balanced market, but with 128 active listing this represents only a few weeks of supply.
With little to choose from and many buyers still on the hunt, this continues to bode well for anyone desiring to sell a home. Many properties continue to see multiple offers, especially properties that are in move-in condition or in highly desirable locations.
With the continued demand and limited selection, prices have continued to rise. Our median home price for the first 10 months of 2021 is all the way up to $1,875,000. To put that into perspective that is a 49% increase from 2019 median price of $1,258,000.
Though it is a seller’s market, we are still finding homes for our buyers with a little more patience and hard work. Hopefully, like years past, we will see more homes and condos on the market after the holidays.
HAPPY THANKSGIVING!
THE HIGH & LOW
October 2021 Highest Sale | 2709 Vista Oceano Ln, Montecito | Sold for $19,500,000
October 2021 Lowest Home Sale | 315 S Canada St A, Santa Barbara | Sold for $795,000
October Statistics
2021 | Year-To-Date
- Total Sales: 1,923 in ’21 vs 1,683 in ’20 | UP 14%
- Total Home Sales: 1,351 in ’21 vs 1,203 in ’20 | UP 12%
- Total Condo Sales: 572 in ’21 vs 480 in ’20 | UP 19%
- Median Home Price: $1,875,000 in ’21 vs $1,494,000 in ’20 | UP 26%
- Median Condo Price: $839,500 in ’21 vs $740,000 in ’20 | UP 13%
- Sales Above $5M: 181 in ’21 vs 84 in ’20 | UP 215%
August 2021
- Total Sales: 172 in ’21 vs 267 in ’20 | DOWN 36%
- Pending Sales: 167 in ’21 vs 192 in ’20 | DOWN 13%
- Total Off-Market Sales: 24 Sales | 14%
- Total Cash Sales: 45 Sales | 26%
- Average 30-Year Fixed Rate Mortgage: 3.24% as of Nov. 22, ’21
0
2122
YEAR IN REVIEW 2021 | SANTA BARBARA REAL ESTATE UPDATESEPTEMBER 2021 | SANTA BARBARA REAL ESTATE UPDATE