Over the last couple months, we have seen a few interesting occurrences in the real estate market.
The first one being in November the Fed decided to end QE3, the program to buy treasury and mortgage-bonds. Since the housing bubble burst the fed has introduced three rounds of quantitive easing (QE). Since the beginning of QE, the Fed has injected $3.8 Trillion into the economy. They printed a lot of money and own a lot of mortgages.
To put it in perspective, prior to the burst the Fed’s balance sheet showed about $700 billion worth of such investments and it has grown to $4.5 Trillion (650% increase). And for further clarity the Federal budget for 2014 was $3.5 Trillion. Though they stopped, they gave a clear message that they could bring it back if the economy becomes sluggish. Why that is important is that it has been used to stimulate the real estate market with lower interest rates and additional capital.
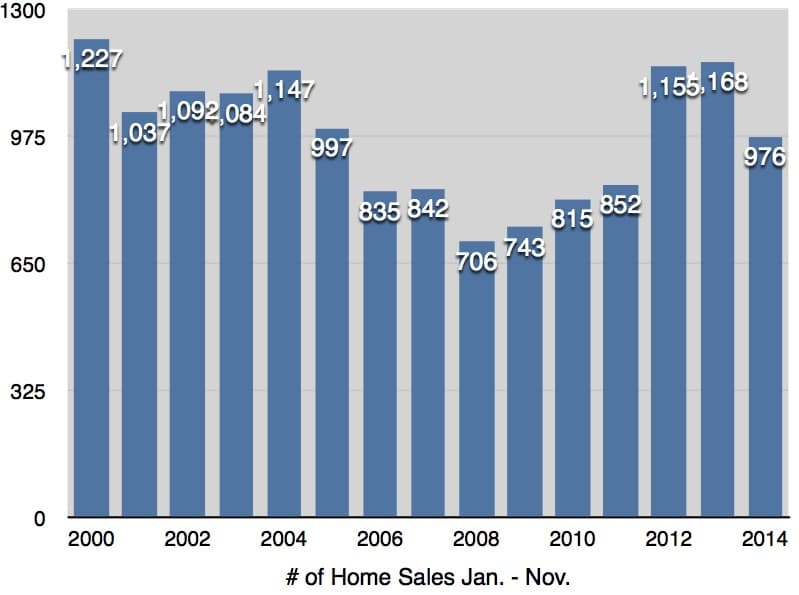
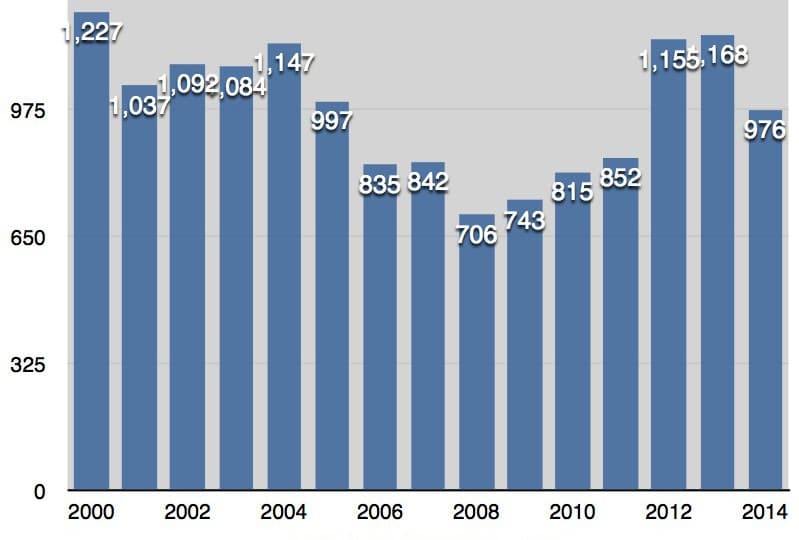
The second occurrence is on a local scale, but also seen across much of the country, is a slowing in amount of sales. With increased prices, less real estate investors, and distressed sales, the total number of sales has decreased consistently for over 12 months. Below is a graph for S.B. sales for the last 15 years.