DECEMBER 2020 | SANTA BARBARA REAL ESTATE UPDATE
How’s The Market?
We continue to have an incredible demand.
A typical November yields an average of 126 sales over the last 7 years. 2020 was dramatically higher with 204 sales. The pace dropped compared to September and October record highs of 272 and 267 respectively, but we don’t feel that means that the demand has dropped. Total sales was most likely slower due to record low inventory, offering very few homes to pick from as well as Thanksgiving, which always causes November to be a slower month.
So what is driving this? It is pretty simple and the most known principle in real estate, Location. You don’t need to be in real estate to know the phrase, “location, location, location.” If these last few months had a theme that is what it would be about.
Our greater Santa Barbara area has just grown more in desirability. We have many more buyers who want to be here and now value this location over their last one.
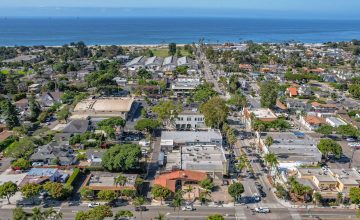
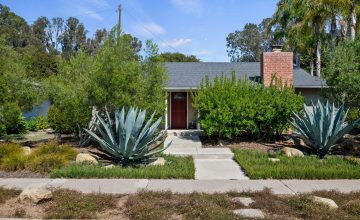
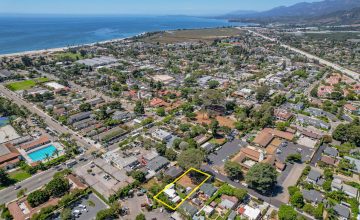
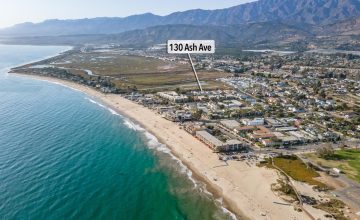
Last week, we brought to market a new listing 7 homes away from the Carpinteria bluffs and beach. The neighborhood is extremely desirable being near the beach and all things Carpiteria, it is an A+ location. We experienced over 65 showings and 23 offers. To paint an accurate picture, we were undervalued a little, but we have never experienced activity like this before. And though this might be an extreme case, so many listings continue to see multiple offers.
So to answer the most asked question we get, “how’s the market?” Well, our number of buyers just increased dramatically and we don’t have enough sellers to meet the demand.
And when that happens, prices rise. Our median home price is now up 21% compared to 2019, that is a big jump given the 7 previous years of rising home prices.
THE HIGH & LOW
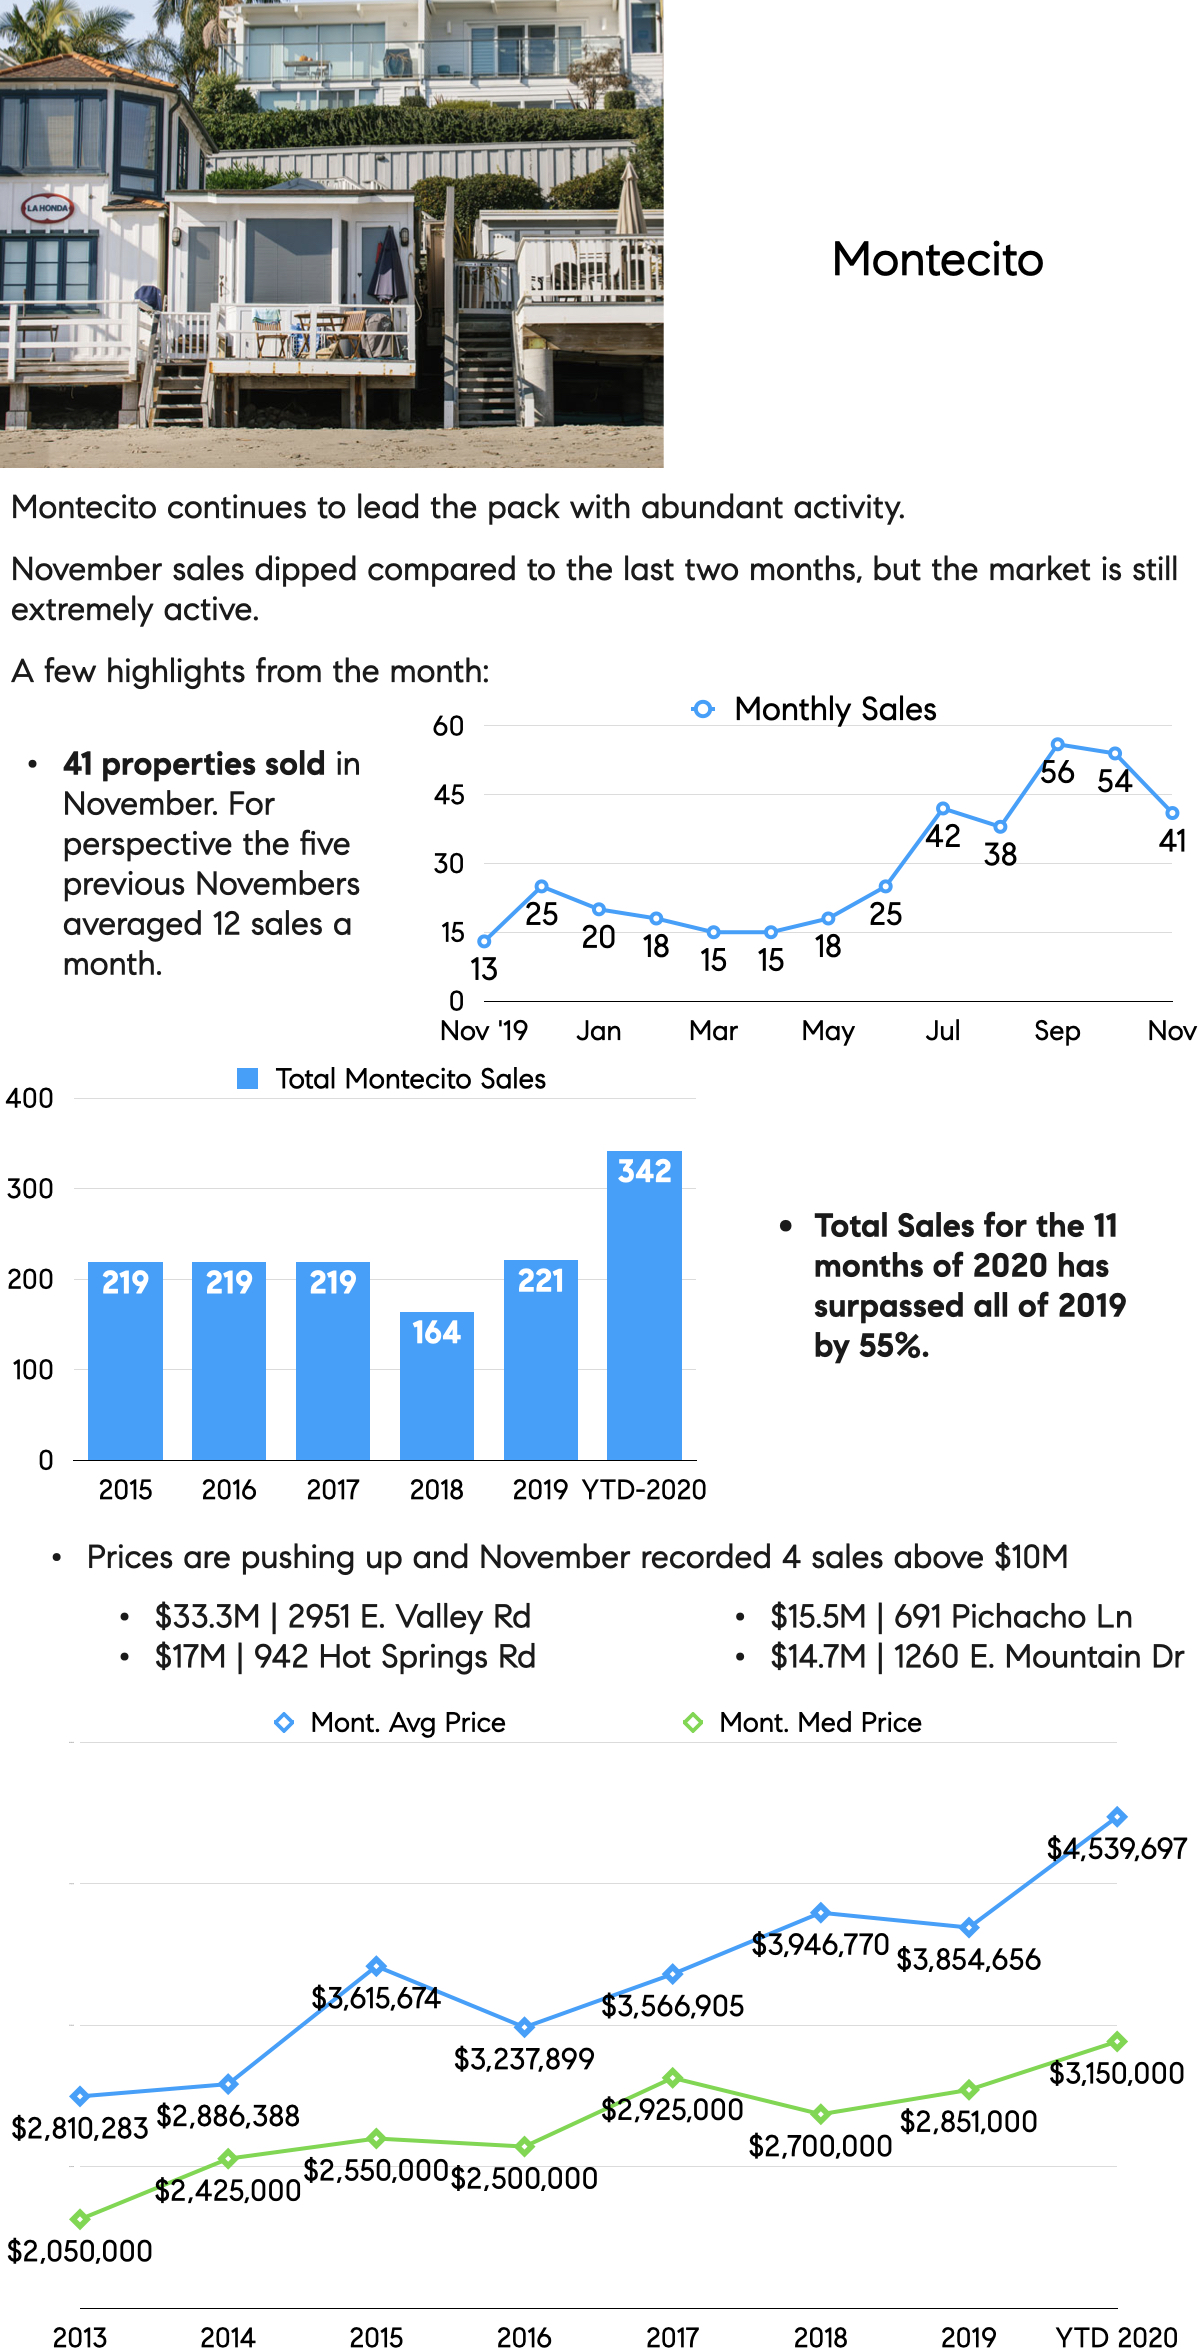
November 2020 Highest Sale | 2955 East Valley Rd, Montecito | Sold for $33,308,250
November 2020 Lowest Home Sale | 102 S Voluntario St, Santa Barbara | Sold for $625,000
November Statistics
2020 | YTD
- Total Sales – 1,887 in ’20 vs. 1,763 in ’19 – UP 7%
- Total Home Sales – 1,351 in ’20 vs. 1,181 in ’19 – UP 14%
- Total Condo Sales – 536 in ’20 vs. 582 in ’19 – DOWN 8%
- Median Home Sales Price – $1,506,500 in ‘20 vs. $1,250,000 in ’19 – UP 21%
- Median Condo Sales Price – $753,000 in ’20 vs. $695,000 in ’19 – UP 8%
- Sales Above $5M – 93 in ’20 vs. 71 in ’19 – UP 31%
November
- Total Sales – 204 in ’20 vs. 124 in ’19 – UP 65%
- Total Pending Sales – 184 in ’20 vs. 123 in ’19 – UP 50%
- Total Off Market Sales – 33 Sales or 16%
- Total Cash Sales – 46 Sales or 23%
- Avg. 30 Year Fixed Rate Mortgage – 2.77% as of 12/18/20
*All data is pulled from the MLS & public records
MORE IN-DEPTH
0
2018