OCTOBER 2020 | SANTA BARBARA REAL ESTATE UPDATE
So How’s The Market?
Like none other! Santa Barbara real estate has not seen activity like this before. The sheer volume of sales is unprecedented. The amount of buyer activity continues to surprise us all.
September was simply a banner month with 272 total home and condo sales.
To put that into perspective, between 2013 to 2019, September has averaged 150 sales. With 272 sales in September of 2020 that represents a 81% increase compared to the average. It hurtled past August 2020 record high of 229 sales.
With this much activity and buyer interest, the median home & condo price keeps pushing up. For the first nine months of 2020, the median price has pushed up 14% to $1,176,000 compared to 2019.
To be transparent, we keep asking ourselves when will this slow. Growth and activity at this pace does not seem sustainable for long. It is hard for us to imagine that this is the new norm, so when will the market come back to a balance?
Right now the answer is not yet. October sales do not appear to be as robust as September. They will come in strong based on what we have seen so far, but we do not anticipate results as high as last month. In addition to the closed sales to date, homes and condos under contract as of October 27, 2020 in our multiple listing service totaled 258 homes. This is well above normal and does not account for our typical 13% of homes selling off-market.
THE HIGH & LOW
September 2020 Highest Sale | 700 Picacho Ln, Montecito | Sold for $44,500,000
September 2020 Lowest Home Sale | 1219 E Gutierrez St, Santa Barbara | Sold for $454,000
September Statistics
2020 | YTD
- Total Sales – 1,416 in ’20 vs. 1,482 in ’19 – DOWN 4%
- Total Home Sales – 1,020 in ’20 vs. 987 in ’19 – UP 3%
- Total Condo Sales – 396 in ’20 vs. 495 in ’19 – DOWN 20%
- Median Home Sales Price – $1,467,250 in ‘20 vs. $1,250,000 in ’19 – UP 17%
- Median Condo Sales Price – $735,000 in ’20 vs. $695,000 in ’19 – UP 6%
- Sales Above $5M – 70 in ’20 vs. 50 in ’19 – UP 40%
September
- Total Sales – 272 in ’20 vs. 156 in ’19 – UP 74%
- Total Pending Sales – 221 in ’20 vs. 140 in ’19 – UP 58%
- Total Off Market Sales – 34 Sales or 13%
- Total Cash Sales – 77 Sales or 28%
- Avg. 30 Year Fixed Rate Mortgage – 3.01% as of 10/26/20
*All data is pulled from the MLS & public records
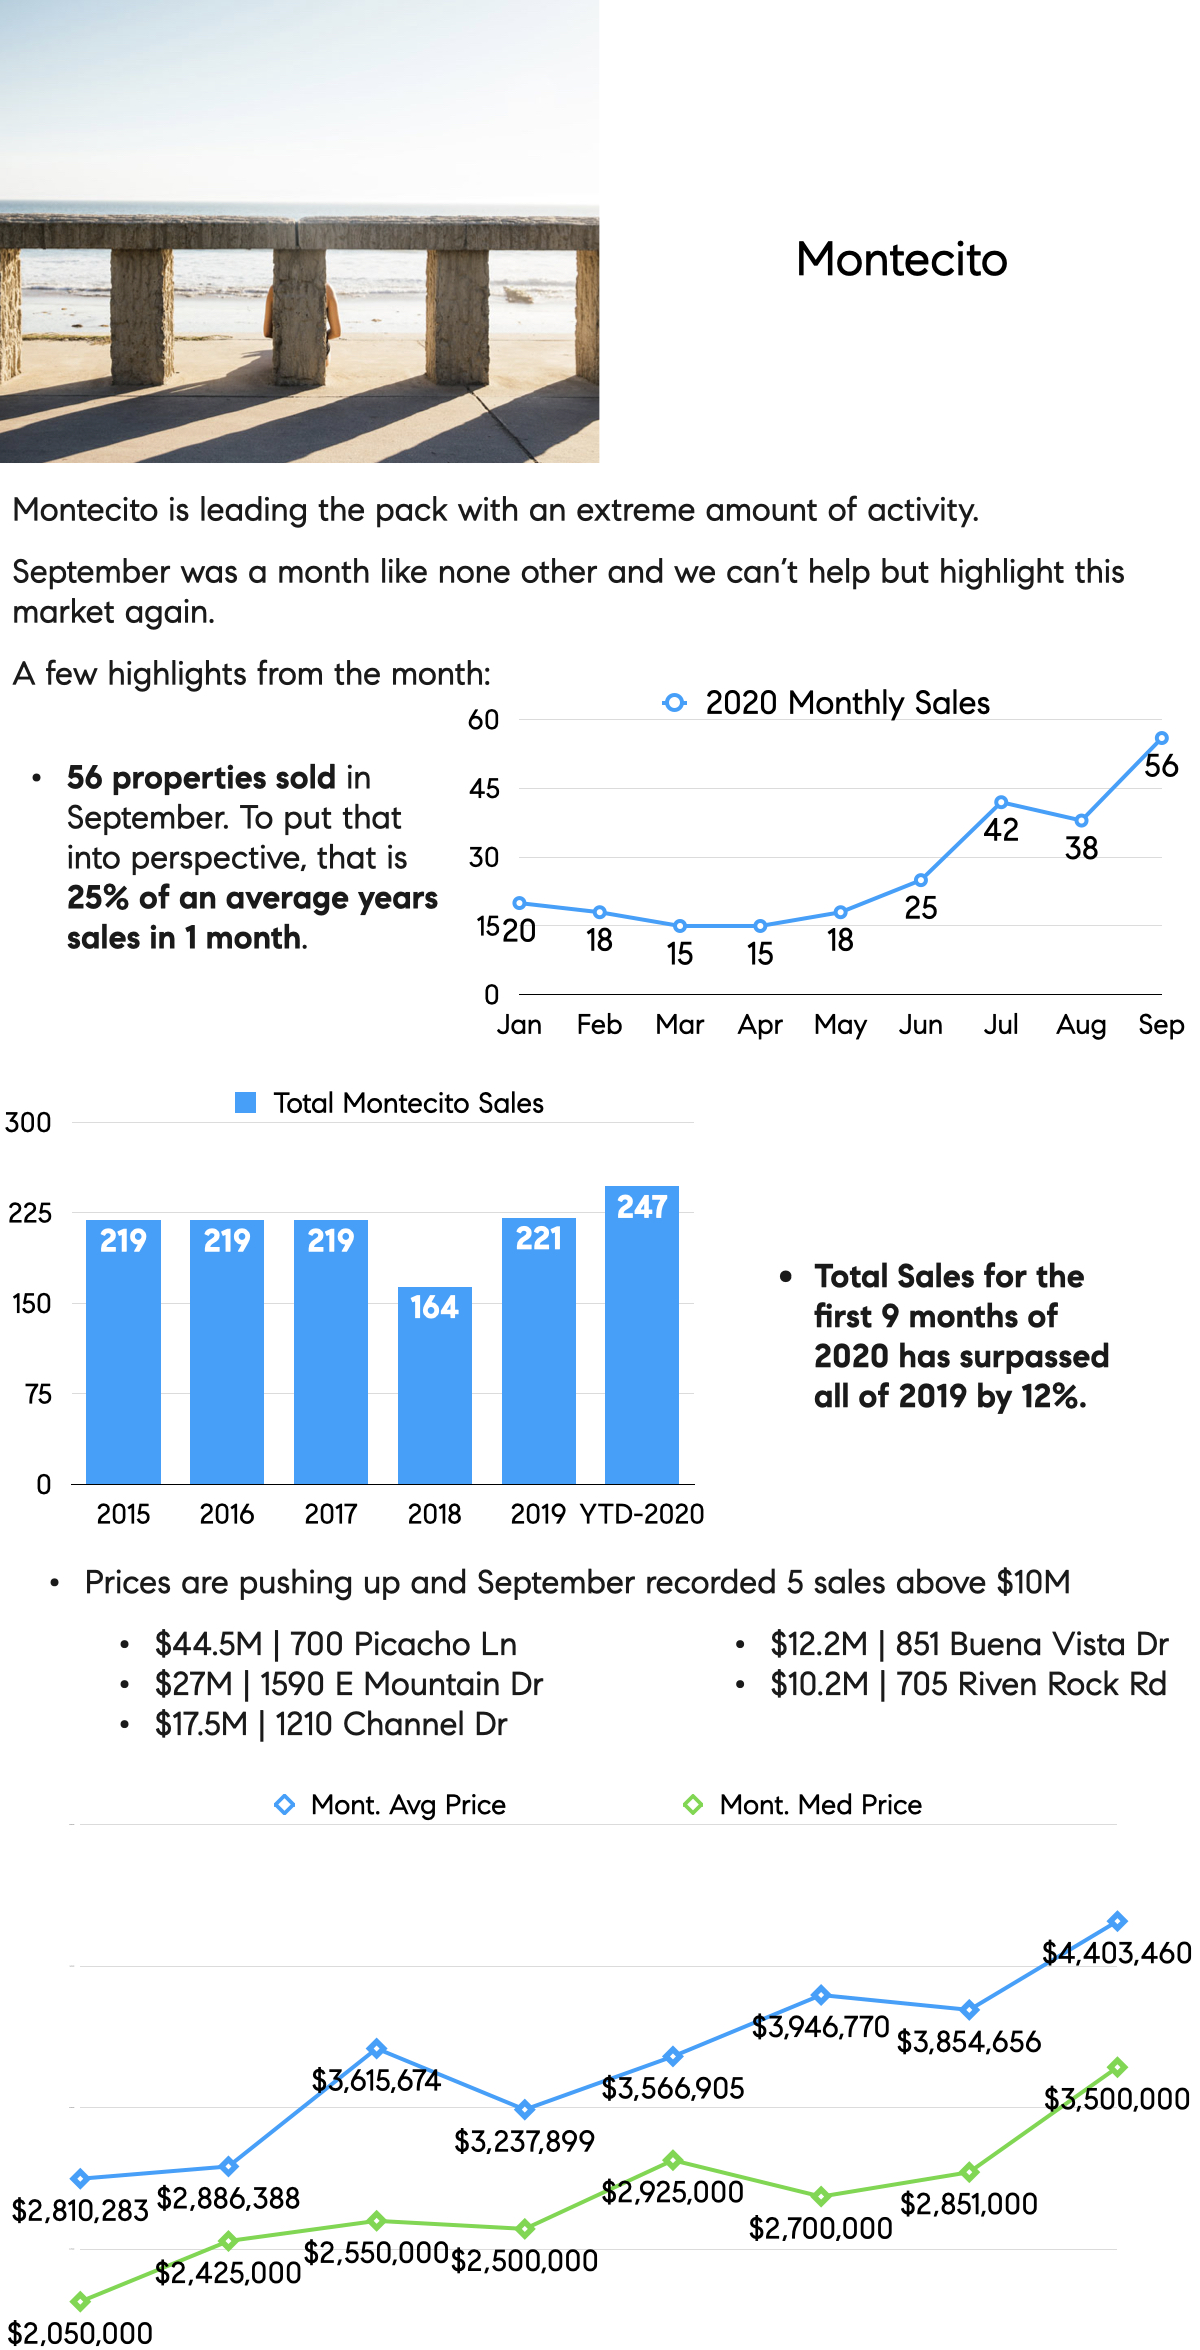
MORE IN-DEPTH: Montecito
0
2002